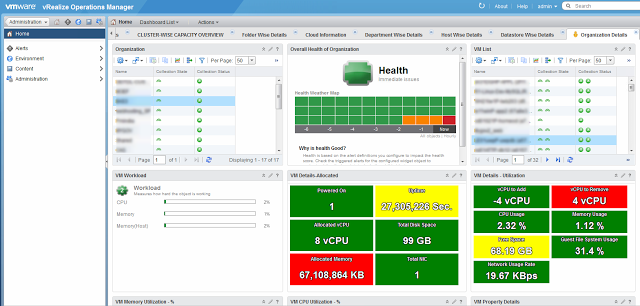
In the above screenshot we can see that in the 1st Widget we get a list of all the available Departments. Also note in 3rd Widget I got a list of all the available VM's in the environment. Now let's logout and login with a customer user that I have created.
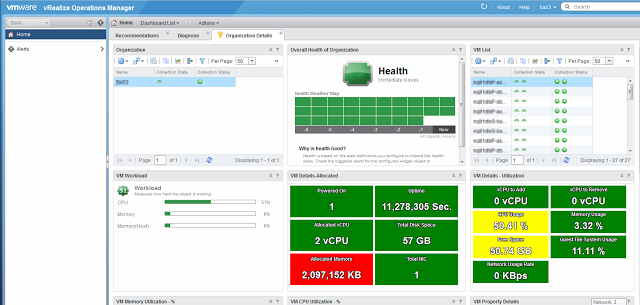
As can be seen from the above screenshot, when logged in with the custom user, I am able to see only the department in which I have permission and in 3rd widget I can see only the VM's related to this Department only. The rest of the widget is shown below:
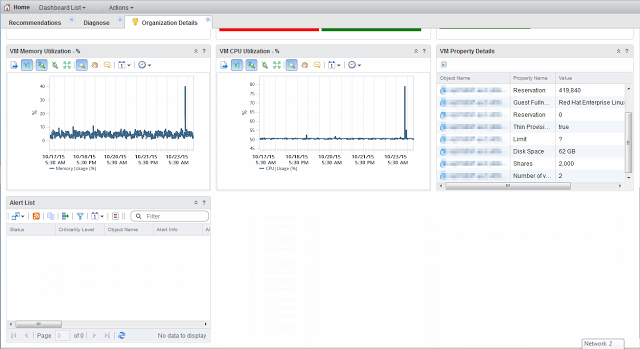
So when the rest of the widgets show information related to the VM selected in the 3rd Widget.
This gives me the exact result which my customer wanted.
This concludes the series. Hope you will find it useful. vROps is a very powerful tool and with the information you can actually build pretty powerful and meaningful dashboard. I have used any Super Metrics in this dashboard, but with those you can reach higher sky.
Let me know if these were useful to you and if you need anything else and we can work together to achieve that.