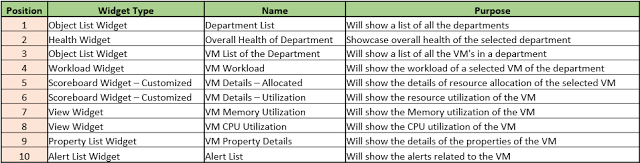
Once the Widgets are added to the dashboard then I need to setup the interaction between them.
Since the first widget (Object List Widget) provides a list of the Departments, so it does not depend on any other widget. I configured it as: Mode: Self , Refresh: On, Refresh Interval : 300 Seconds, Auto Select First Row: On Also in the "Object Type" I selected "Department". This concludes the configuration for this Widget.
The second widget "Health Widget" shows the overall health of the selected Department and hence depends on the 1st Widget.
The 3rd widget is again an "Object List Widget". I named it as "VM List of the Department". Again this is a widget which does not take input from any other Widget, so, the configuration for this Widget is similar to the 1st Widget. The only difference is the "Object Type". For this I selected "Virtual Machine". Note, this will show a list of all the VM's in the environment. The rest of the widgets will depend on this 3rd Widget for their input. So the dependency of other Widgets is on the information on this widget. Next comes the 5th and 6th widget, Customized Scoreboard Widgets. I customized it according to my requirement and the XML related to these widgets are provided below:
5th Widget: Overall Allocation:
6th Widget: Overall Utilization:
Note the parameters that I am monitoring here. For a detailed list of parameters you can check the documentation at vROps documentation for metrices. Provided below is a screenshot from where you can add customized XML files.
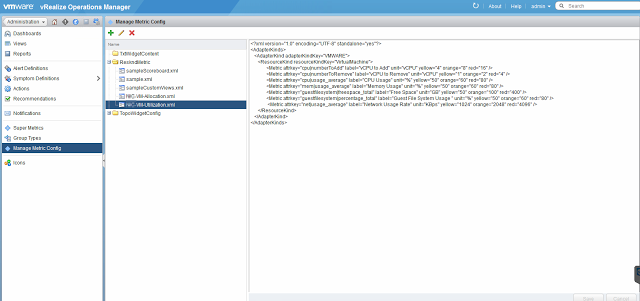
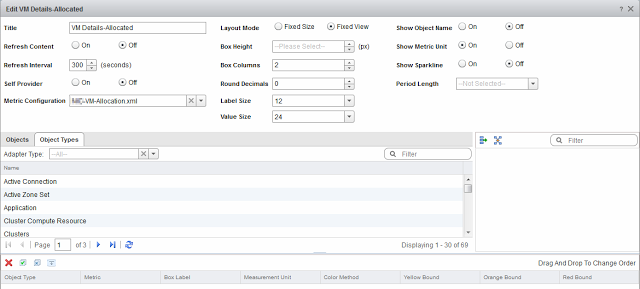
Now when we configure the 5th and 6th widgets all we need to do is to select the XML file that we created in the Metric Configuration window. You can see the same from the below screenshot.
Once the configuration of the widgets is finished. I need to create custom users and roles. Remember the 3rd Widget where we got a list of all the VM's. But our primary aim was to show case only those VM's which are related to the selected Department only. To achieve this first we will create a custom group, the dashboard will be provided to this group so that whoever is part of this group will be able to see the dashboard. Next we will create a custom role which will be copies from Read Only role and further customize it so that all the unnecessary information will not be shown. Again there is an excellent blog from Jason Gaudreau about how to create custom roles and access policies, so I am not going to cover that portion here. Please check the information at Jason Gaudreau's Blog: vRealize Operations 6.0 - Access Control and Dashboard Management. All I am doing here is creating custom user with Custom Read Only information (roles only which is required to show minimum information) and provide them access to the required Department only. So when I will log in with the user id, I will be able to see the only Department for which he has access in the 1st widget. Also since I have access to that department and its child items only so I will be able to see only those VM's which are part of that department only in the 3rd Widget.
So we have covered all the configuration portion. In the next blog we will see result.