Purpose:
Recently I had a request from a customer to build a custom Dashboard for vRealize Operations Manager for their environment. I thought of sharing my experience with you so that in the process I can show how to build a solution to a requirement. In doing so I will cover customization of vROps to a great extent. This is going to be a multi-part post. The requirement and environment is described below:
Environment:
It is a vCloud Director environment with multiple organizations hosted in it. Also inside few of the organizations VM's from multiple department of that organization are hosted. All the VM's belonging to a particular Department follows a particular naming convention.
Requirement:
To provide a custom dashboard to the end users where the end user can only see the required information about the VM's belonging to their Department. The Dashboard should provide CPU, Memory utilization of the VM's and other VM related information. The dashboard should not be a complicated one as the end users are not very comfortable with the myriad information provided by vROps.
Solution:
The fine points to the requirement and their respective solutions are provided below:
- Decision 1: The first point is, how to identify different group of VM's belonging to different departments so that we can show information about only those VM's.
- Solution: Had there been separate Organization VDC's for different departments then could have easily installed vCloud Director plugin and could get the segregation. But here multiple department VM's are hosted in a single Org. VDC. The positive side is each set of VM's has their own unique naming convention. To create the segregation I will create separate Custom Groups for different VM's. I will actually different Department's for different group of VM's. Also I will keep the membership dynamic so that whenever a new VM is added with the same naming convention, by default it will be part of this group.
- Decision 2: How to limit a user from a department to see only those VM's not someone else's.
- Solution: The solution to this requirement is easy enough. Just create a custom role, create a user and give the user permission to those Custom Groups only where he has rights to. Since I want to limit the end users to see nothing else than the Dashboard so I had taken the read only permission and further customized it according to my requirement.
- Decision 3: What to show the end users or the layout of the dashboard. The dashboard layout is provided below:
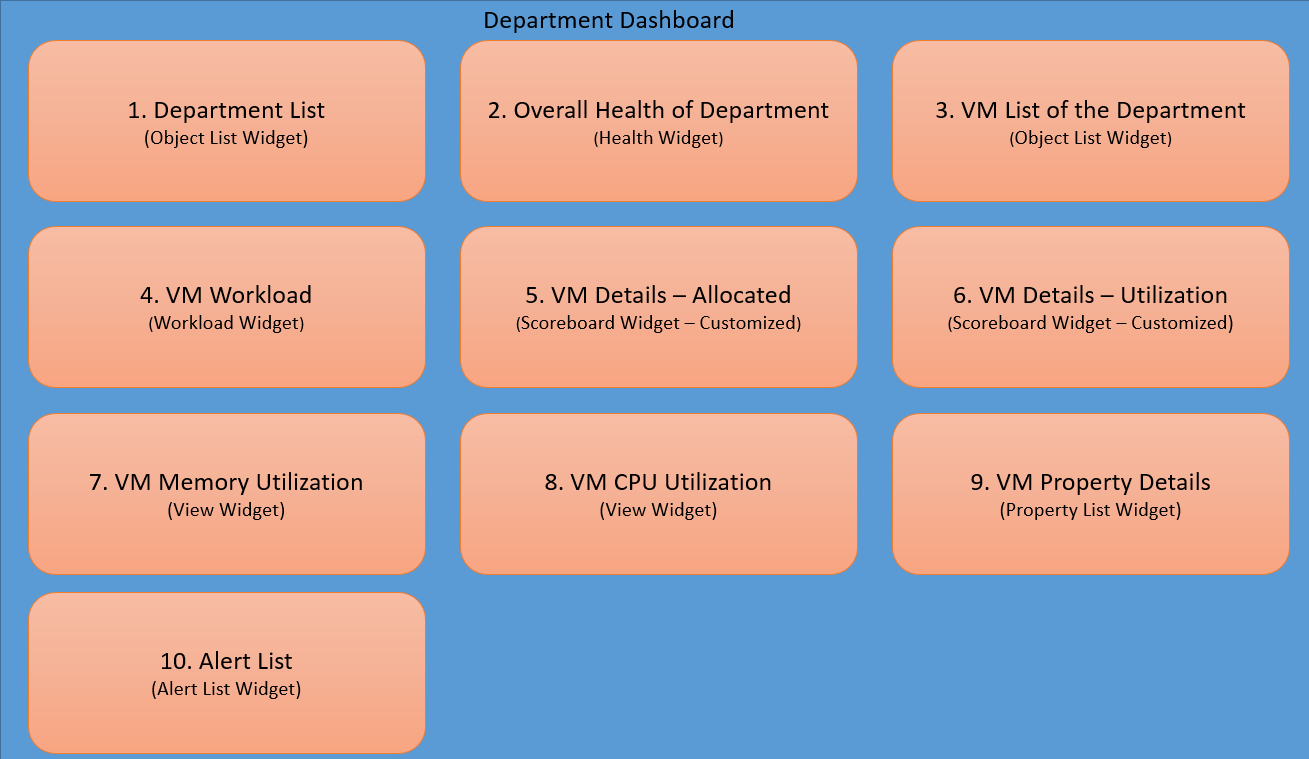 |
| vROps Custom Dashboard Layout |
The interactions and behavior of the Widgets are provided below:
- When logged in as admin, a list of all Departments is listed in 1. Department List Widget.
- When a department is selected overall health of the Department VM's is shown in the 2. Overall Health of Department widget
- The third widget is 3. VM List of the Department. It is a Object List Widget. This is a standalone widget. By default it shows a list of all the VM's in the environment. Note when logged in as Admin, this particular widget will show all VM's.
- The rest of the widgets from 4 to 8 shows information regarding the VM selected in 3rd Widget. So they take input from this Widget.
- 10th Widget is an Alert List Widget which shows the alerts pertaining to the Department only.
Note in the step 3 above when logged in as Admin you get all the VM list, but when logged in as an end user you get to see only the VM's related to the Custom group.
This concludes the Part 1 of the series. In Part 2 I am going to talk about exact configurations of the user roles, Dashboard and Widgets. In the last part we will stitch everything together to build the solution.
So keep reading.