Dear Reader, this is the second part of the vROPS for NSX post. In the earlier Part I post I have discussed about the installation and configuration of the PAK file in vROPs environment. In this part I am going to discuss the results of the configuration, i.e, what information we get from the solution. As could be seen in the earlier post, when we install this solution we get two adapters, first one for NSX-vSphere adapter and the second one for Network Devices. For this post I did not configure any Network Devices and hence have only NSX for vSphere environment for monitoring. Once the solution is installed and configured you would get the following extra Dashboards by default.
- Physical Network Overview
- Network Device Connectivity
- NSX-vSphere Main
- NSX-vSphere Topology
- NSX-vSphere Object Path
- NSX-vSphere Troubleshooting
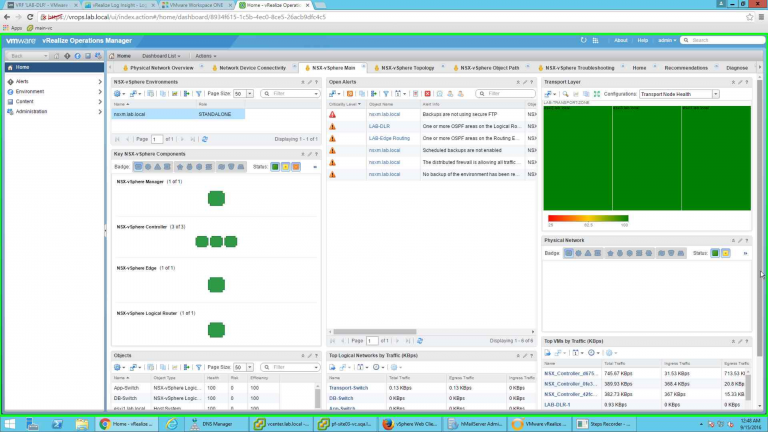
In all these I am not going to cover the first two i.e., Physical Network Overview and Network Device Connectivity. I will focus on NSX-vSphere dashboards. The first one is the NSX-vSphere Main and it shows overview of your entire NSX environment. This dashboard shows the information according to the NSX manager, Key components health, open alerts, Transport layer health, Objects under the manager, Top Logical Switches by Traffic and Top VMs by Traffic. Using this dashboard you can get the health of your entire environment at-a-glance.
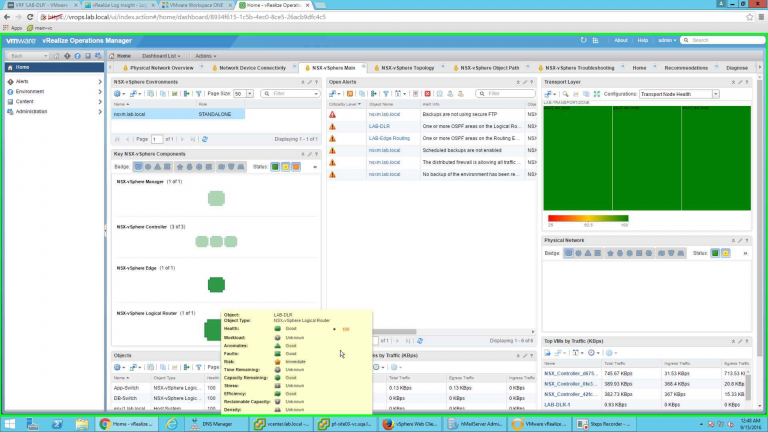
Note, as like any other vSphere object if you keep cursor on any Key Component it shows the details about that component in a popup window.
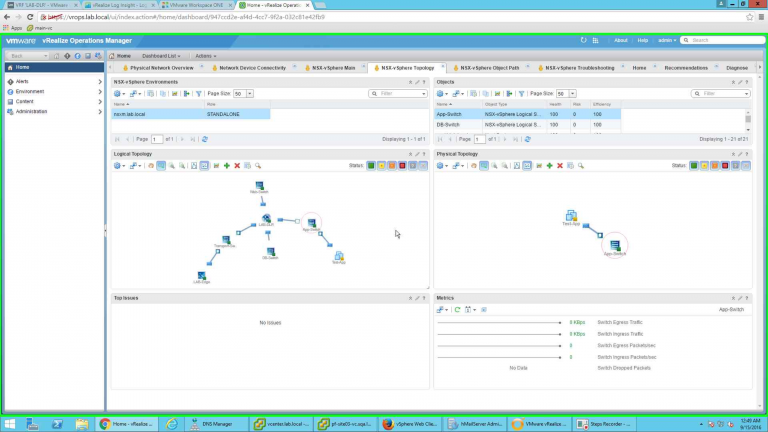
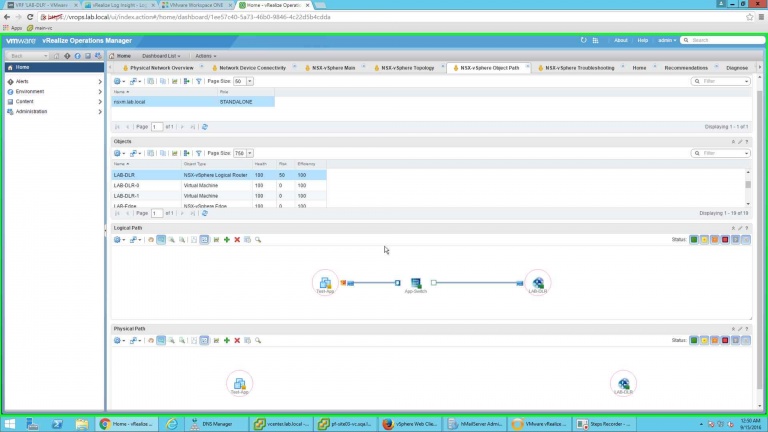
The next Dashboard is the NSX-vSphere Topology. As the name suggests, you select the NSX Manager and the Object of the manager and you get to visualize the Logical Topology, Physical topology along with Top Issues for that object and the Key matrices for that object.
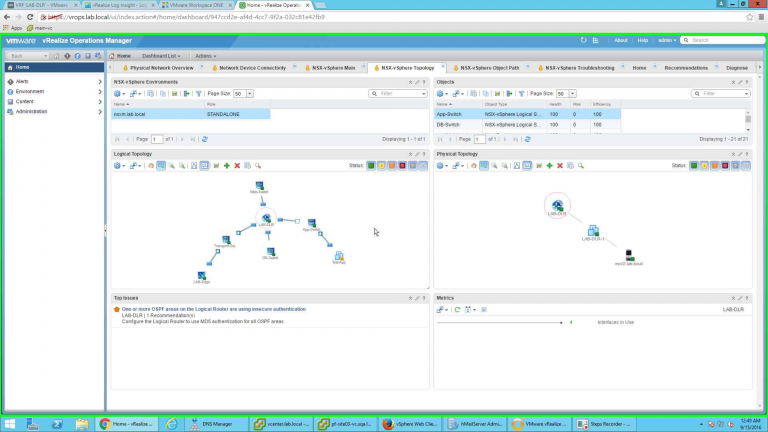
Provided below is another screenshot of the same Dashboard where I have selected by distributed router and it has some issues to show.
The next dashboard is the NSX-vSphere Object path. It is again pretty similar to the earlier one, difference being here you select two different objects of the NSX environment and get to see the Logical and Physical path between these two objects. The next Dashboard is for troubleshooting. Since there were no issues in my environment so not much was there to show in that dashboard and hence I am skipping that one here.
The next area where you will find a lot of information is the Inventory Tree. Here you can individually select and see the information for the following areas.
- NSX-vSphere Control Plane
- NSX-vSphere Edge Services
- NSX-vSphere Logical Routers
- NSX-vSphere Transport Zones
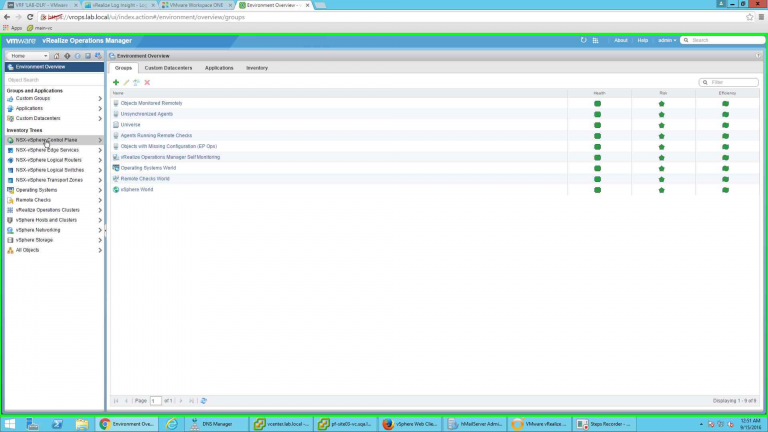
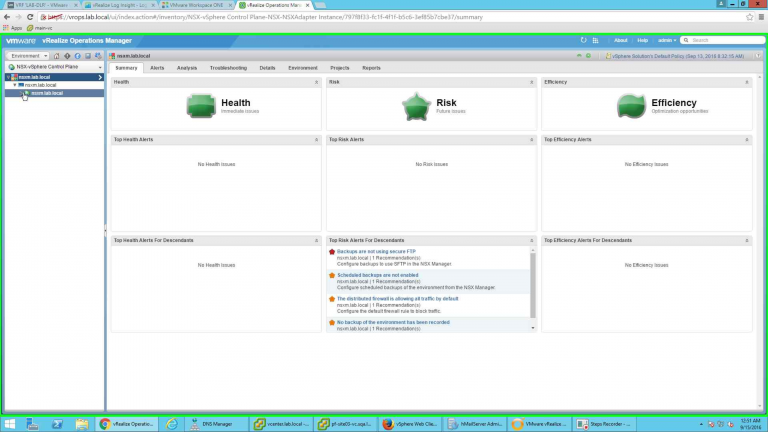
If I select the Control Plane, I can see the details health of the NSX manager.
And then the details health and other details for each and every Control Cluster node member. Just select any one of them to see the details.
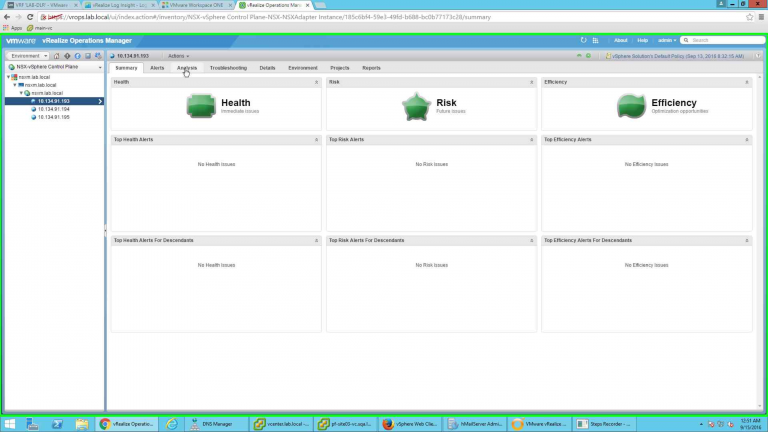
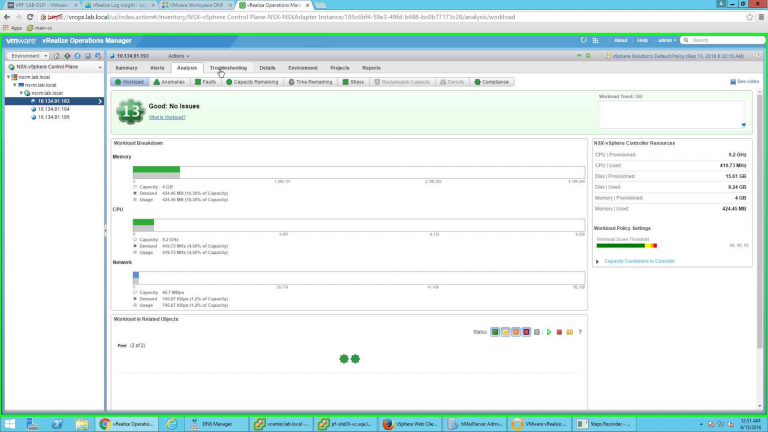
Workload information about the Controller Node.
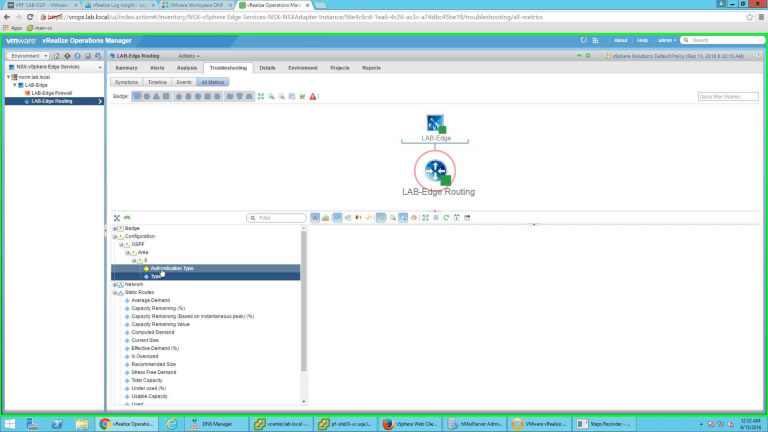
Similarly, I have selected the Edge that I have configured. Notice the two major information from the Edge, Firewall and Routing. It will show the information about these two distinct capabilities of the Edge. Also note, in the All Metrics section it shows me the OSPF details that I have configured for this Edge. Had I configured Static Routes, it would have shown me details of that as well.
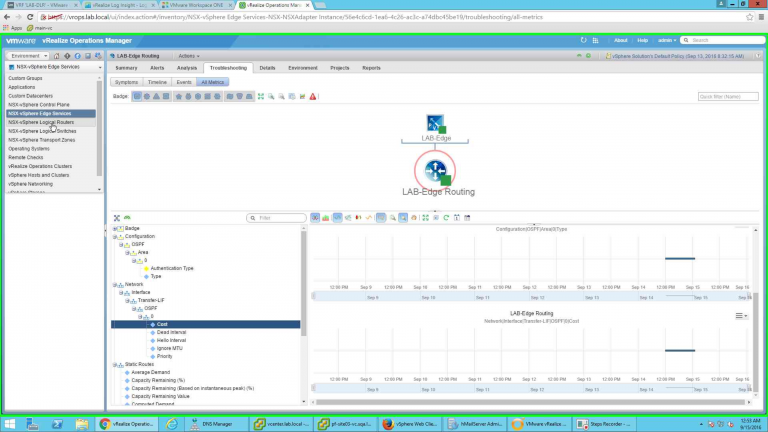
More information from the Edge.
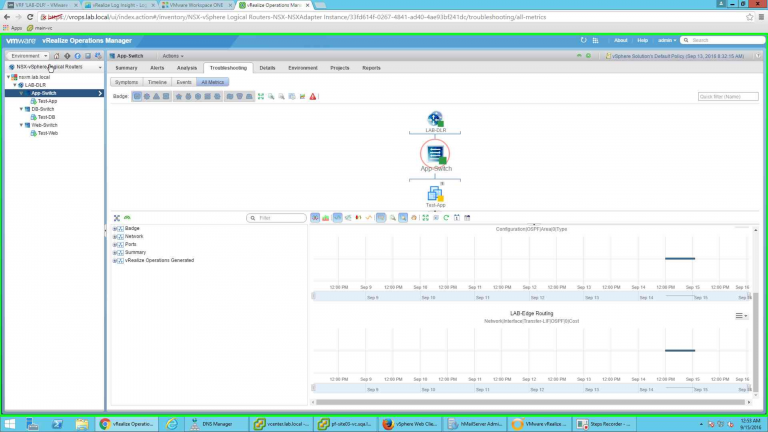
Next, I wanted to see the details of the logical router that I have configured in my environment. I have three logical switches configured and attached to this router. I can see the details of the Tree at the left side of the screen and can get details about any of them by selecting it from there.
More details about logical switches.
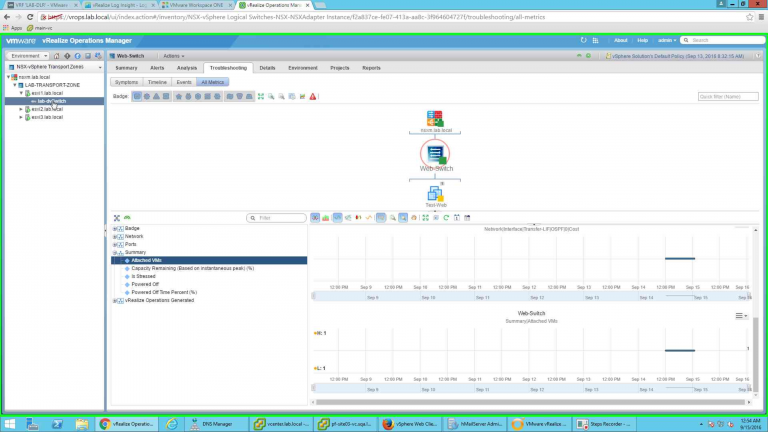
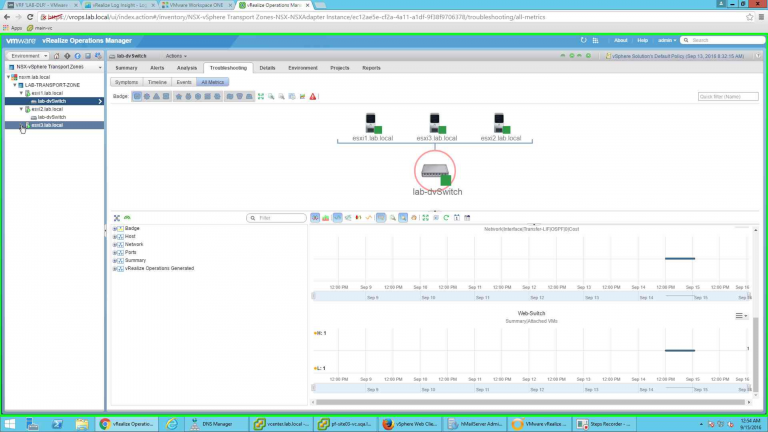
Next, in transport zone it shows the hosts and the switches details. You select the switch and get the details of the switches.
So the question comes what to do with all these information. From my experience I can tell you if there is any issue and you can actually visualize the environment, resolution becomes easier. With this, you can actually co-relate between each components and then drill down further to pin point where the problem is. Also for any issues you can simply open in context of Log Insight (remember we enabled it?), like for any vSphere issue we can open it in context in Log Insight, we can do same for NSX as well. On top of that, if you have configured Physical Network Devices monitoring then you have an end-to-end visibility in your environment.
I would say with this I would be able to solve any NSX related network issues in my environment in no time.
Of course if you need more in-depth true network analysis then you have vRealize Network Insight, but given the option and capabilities this is pretty cool.
Keep exploring.