Hi Reader, I am back with another blog. I thought of writing a series of blogs on vRealize Automation. It seems not enough is discussed about the internal architecture and the generic configuration steps are too complex and needs some explanations. But before I do that, I thought of sharing a tutorial on "Installation and configuration of vRealize Network Insight". This is the newest addition to VMware kitty and the most happening kid at the moment :). So thought of taking it for a spin in my lab. Provided below are the steps from the experience.Before we start, here is a small intro to the product.
vRealize Network Insight is a product for delivering intelligent operations for your software defined network environment (specially NSX). In short it does what vRealize Operations does for your virtualized environment, but only to the SDN environment. With the help of this product you can optimize network performance and availability with visibility and analytics across virtual and physical networks. Provide planning and recommendations for implementing micro-segmentation security, plus operational views to quickly and confidently manage and scale VMware NSX deployment.
To start the deployment you need to download the following two appliances from VMware website:
- VMware_vRealize_Network_Insight_3.0.0-1469457715_platform.ova
- VMware_vRealize_Network_Insight_3.0.0-1469457715_proxy.ova
We will start with the deployment of the platform appliance.
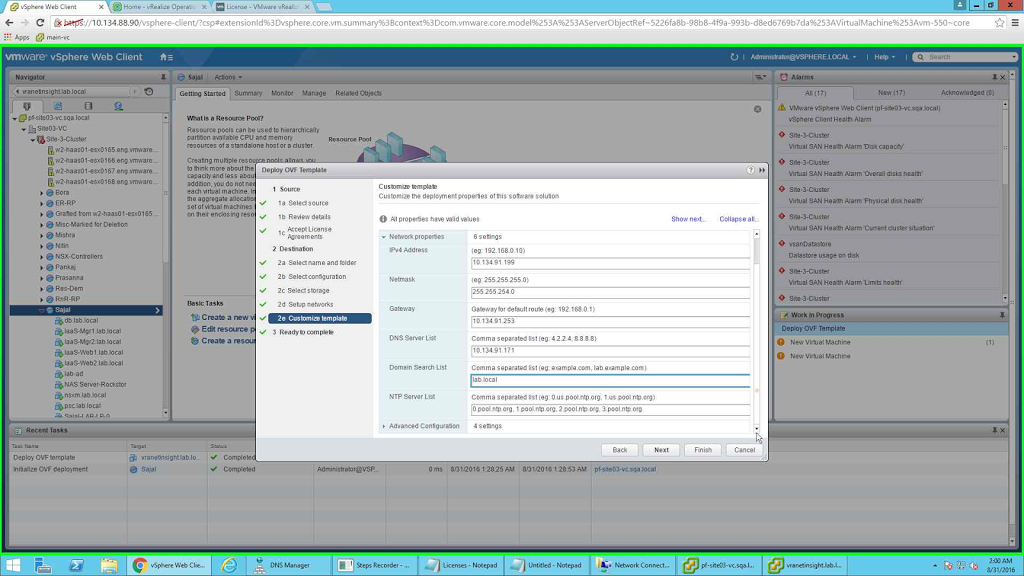
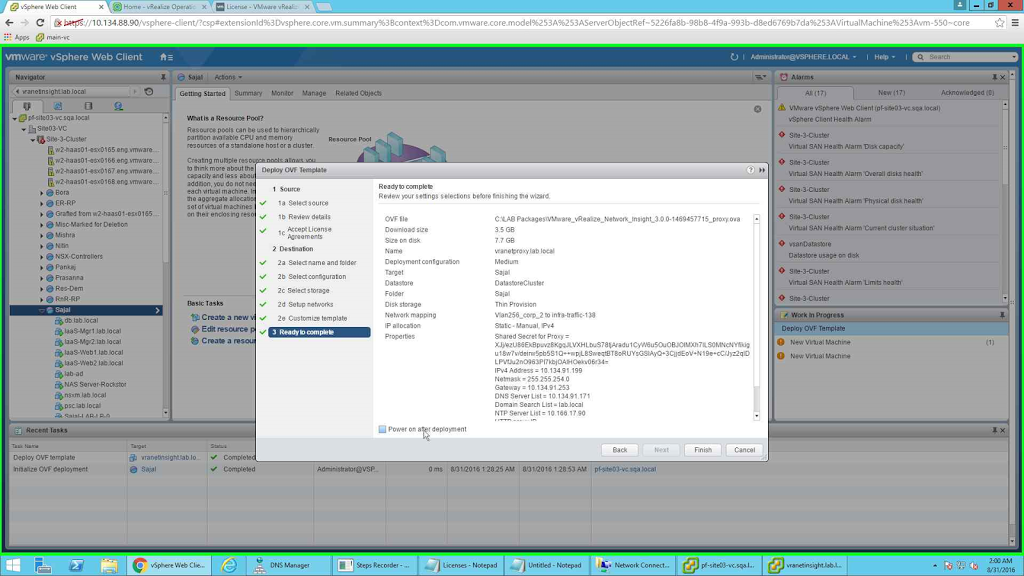
For keeping the length of the post to a reasonable length I have omitted the OVA deployment steps (you already know how its done :)) except the final network input screen.
 |
| Network details input |
 |
| Advance setting for network |
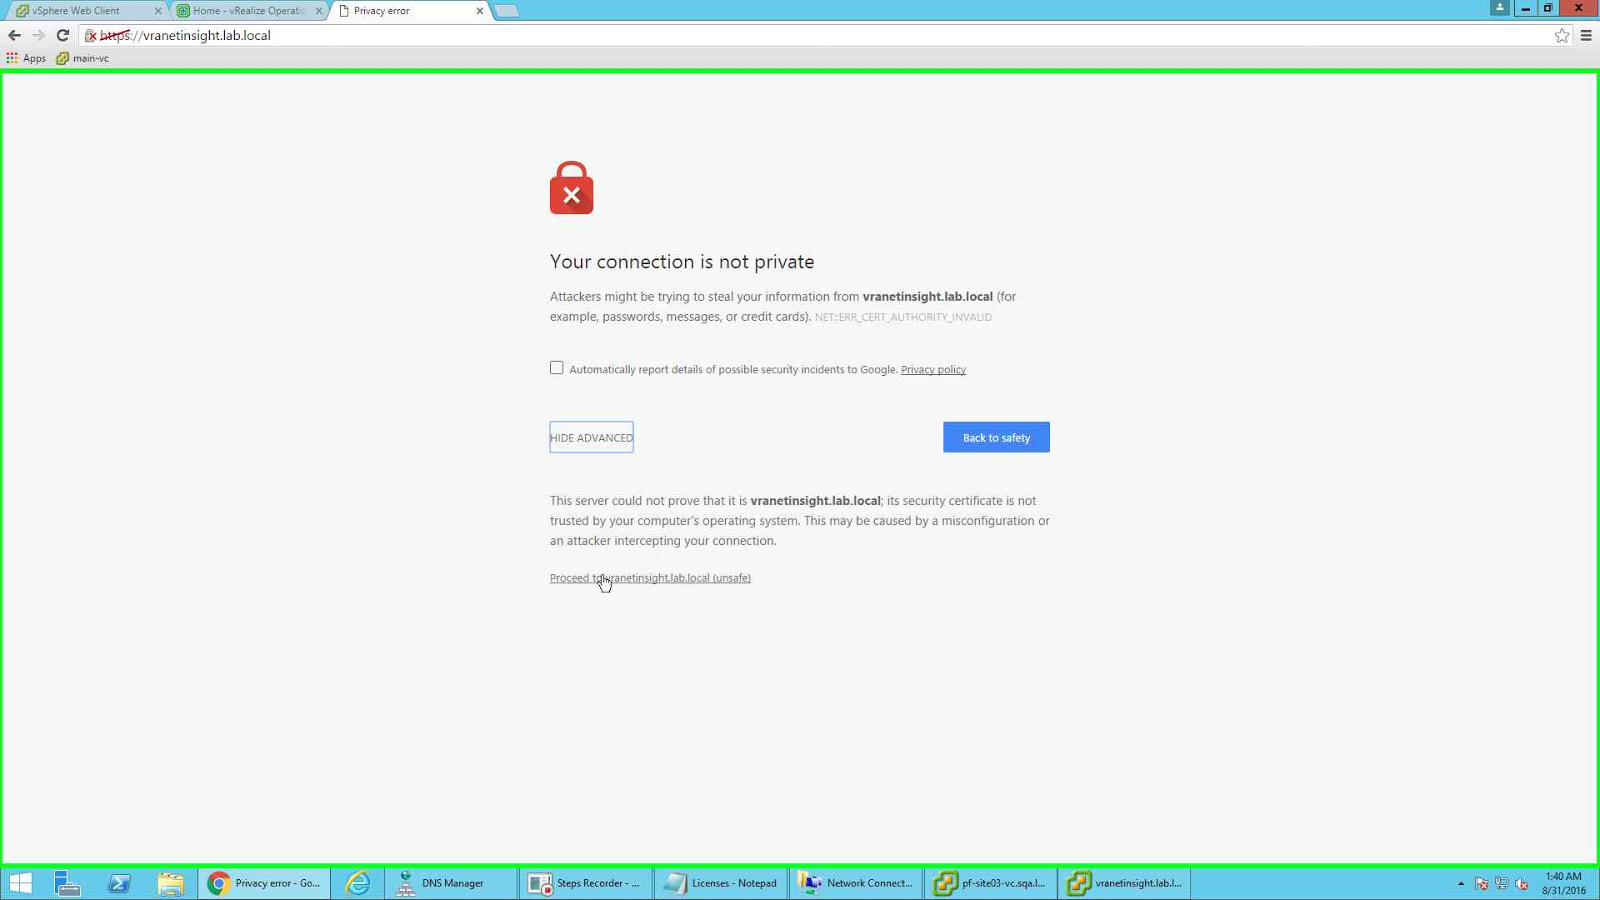 |
| Accepting certificate warning |
 |
| License validation page |
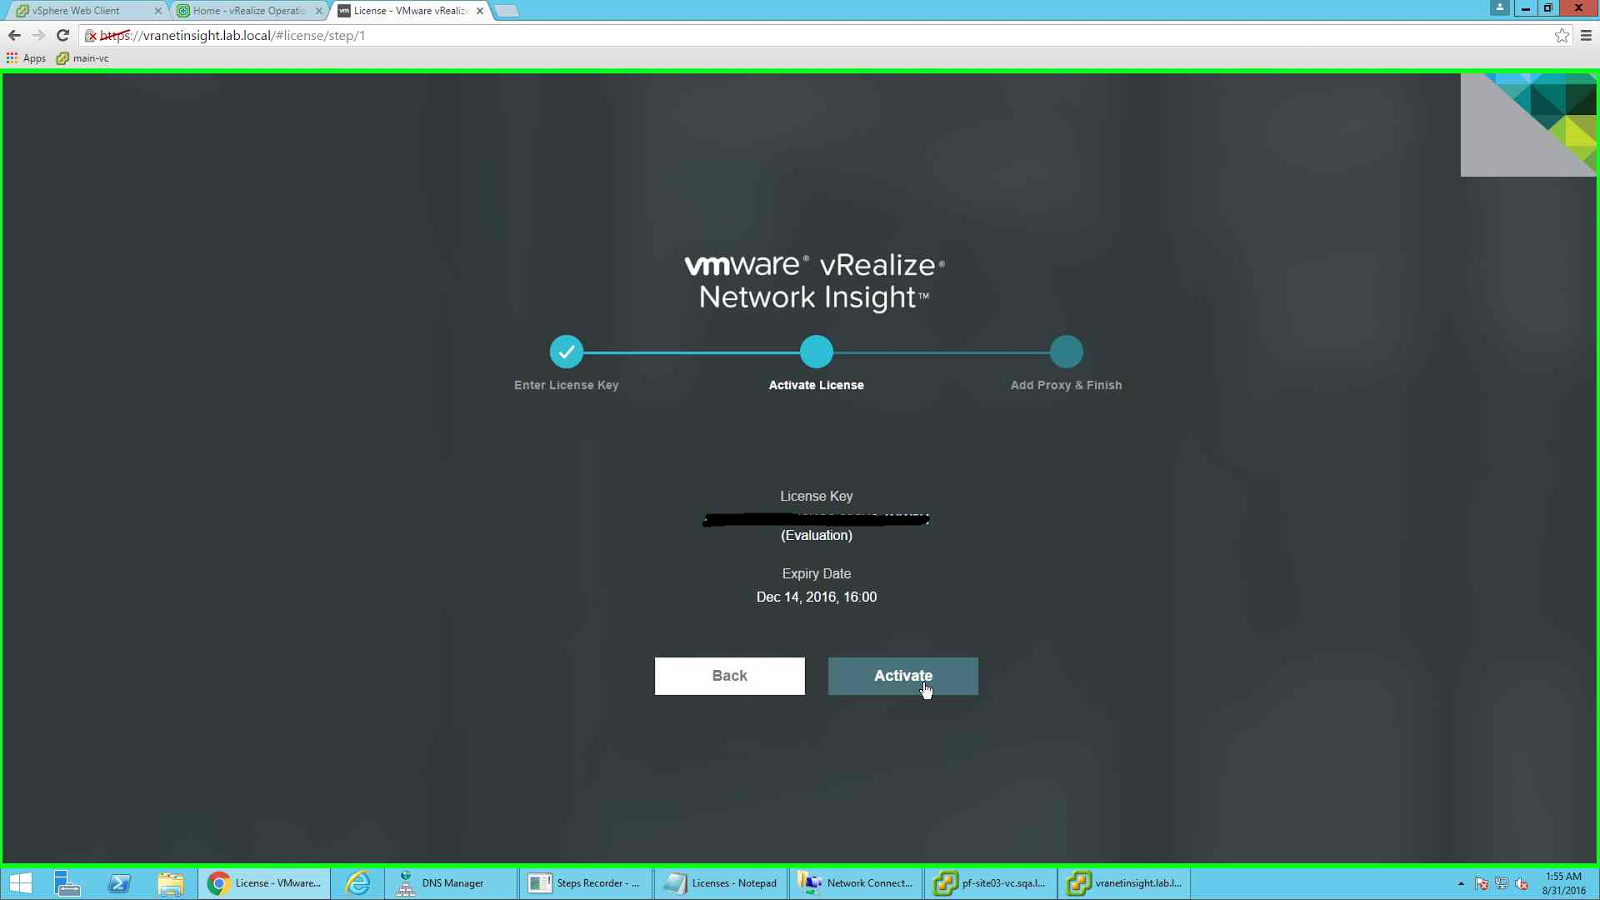 |
| Validated details of license |
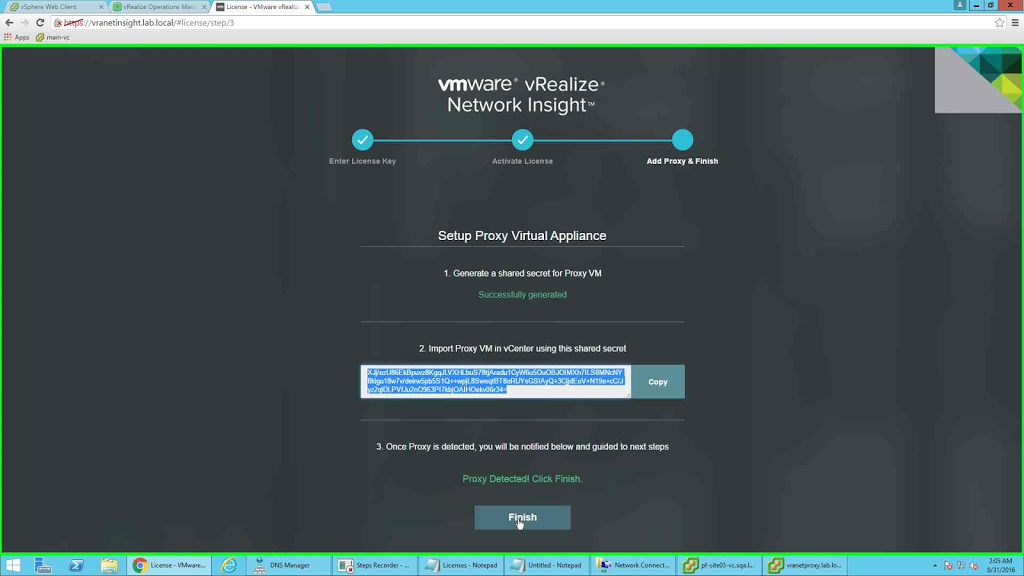
Next click on Activate button to activate the license. The next page is for generating the secret for the proxy VM. Click on Generate button to generate the Secret.
 |
| Secret generation page |
Once the secret is generated we have the Copy button to copy the secret.
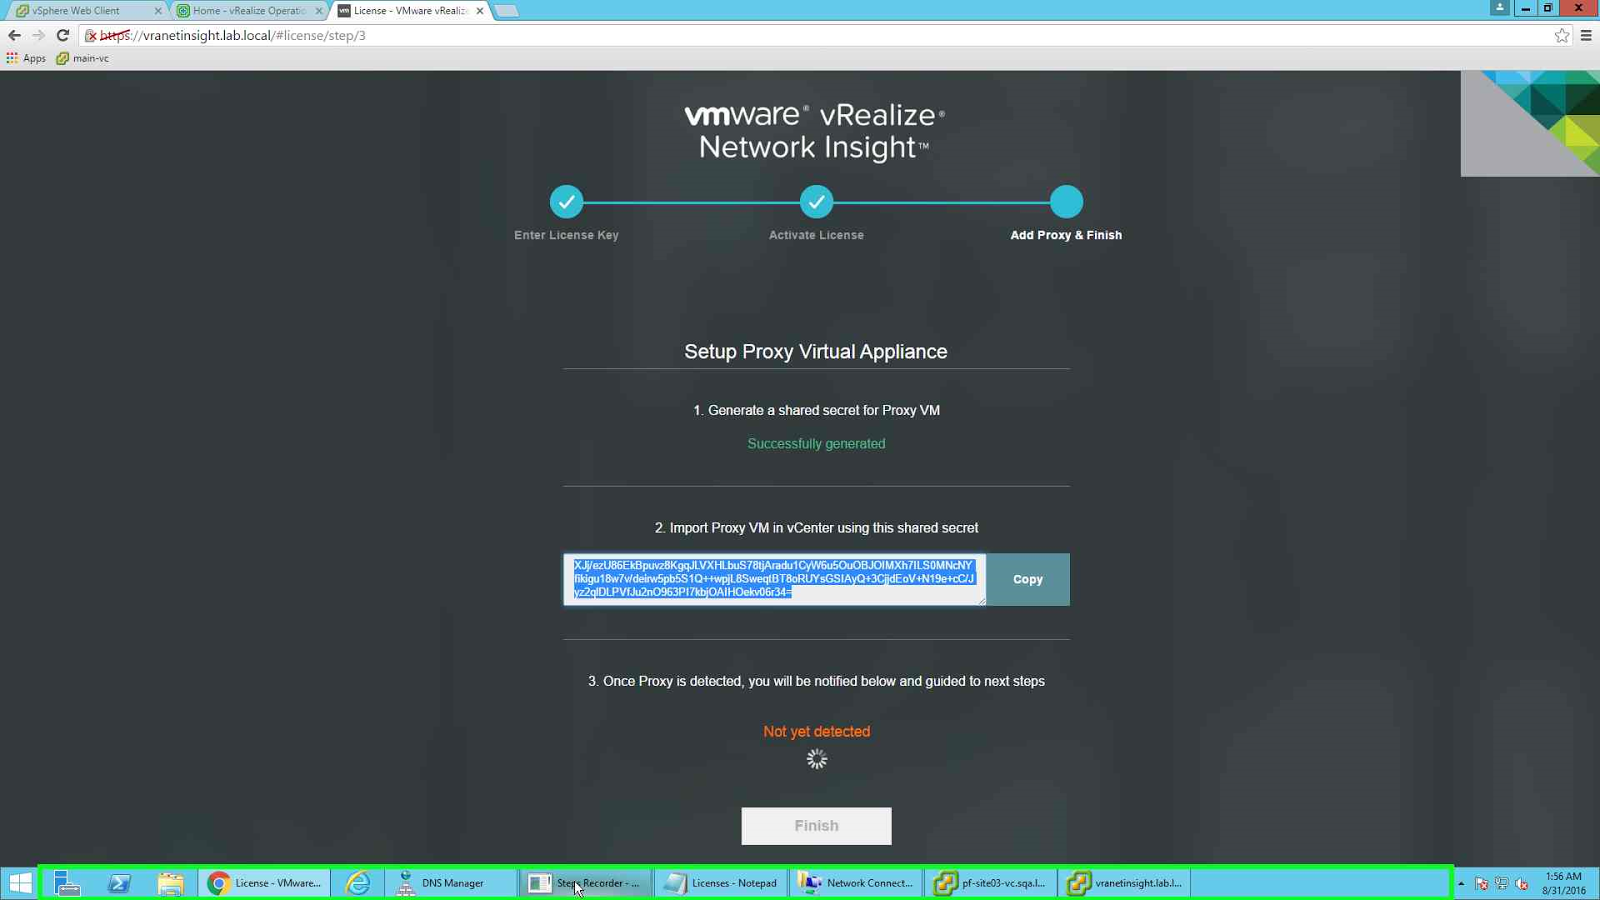 |
| Secret generation and copying stage |
Next the setup will wait for the deployment of the Proxy VM. It will keep looking for it till the time the deployment is done. So let's go ahead deploy the Proxy VM. The deployment is similar to any OVA deployment. One difference is in this case you need to provide the above generated secret at the deployment stage of the OVA.
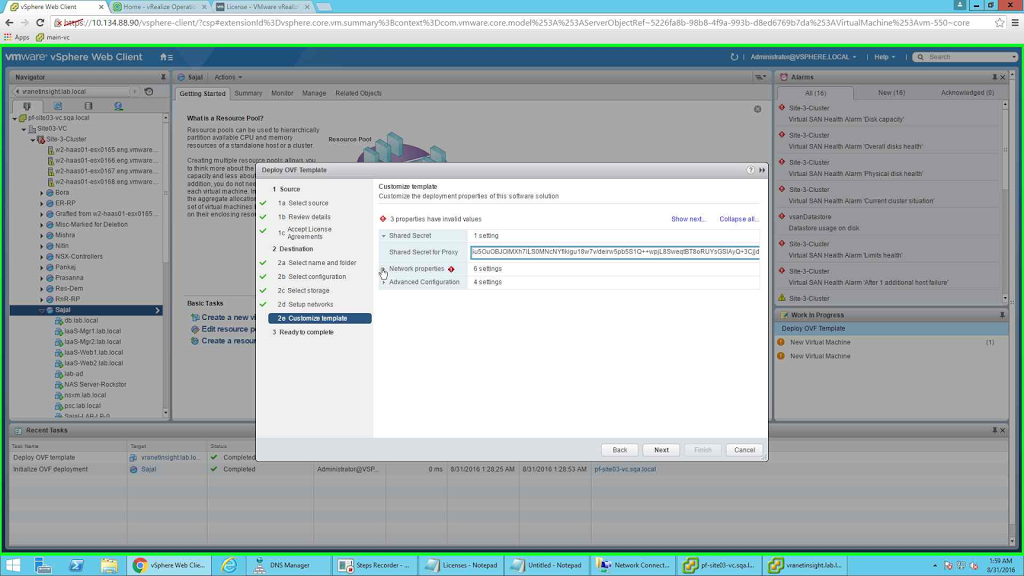 |
| Secret providing at the OVA deployment of Proxy VM |
The next two screenshots are the details options providing at the time of OVA deployment. It is similar to the ones provided at the time of platform deployment (still providing them for your reference).
 |
| Details page 1 |
 |
| Details Page 2 |
Once the deployment is done and the Proxy VM is up and running, it is sensed in the configuration page.
 |
| Auto Sense the presence of Proxy VM |
Click on Finish to finish off the installation.Congratulations !!! your have done a successful installation.
Now let's configure the environment.
To go to login page simply type https:// in your favourite browser. In my case it is https://vranetinsight.lab.local. It takes you to the login page. The default id is "admin@local" and password is "admin".
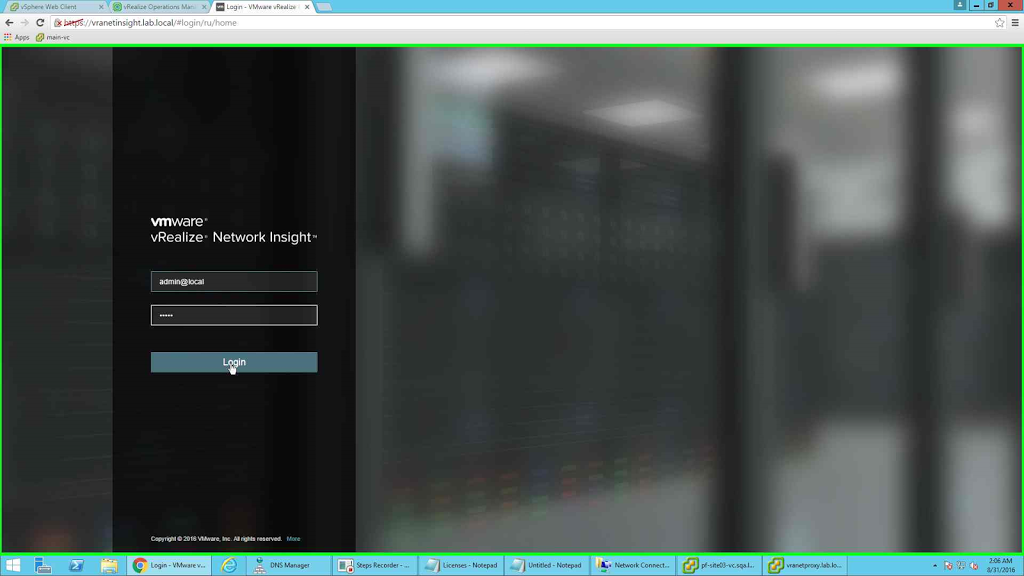 |
| Login Page |
Once you are logged in, by default we are in "NSX Assessment Mode", we can keep continuing on that mode or change to "Full Product Evaluation" mode.
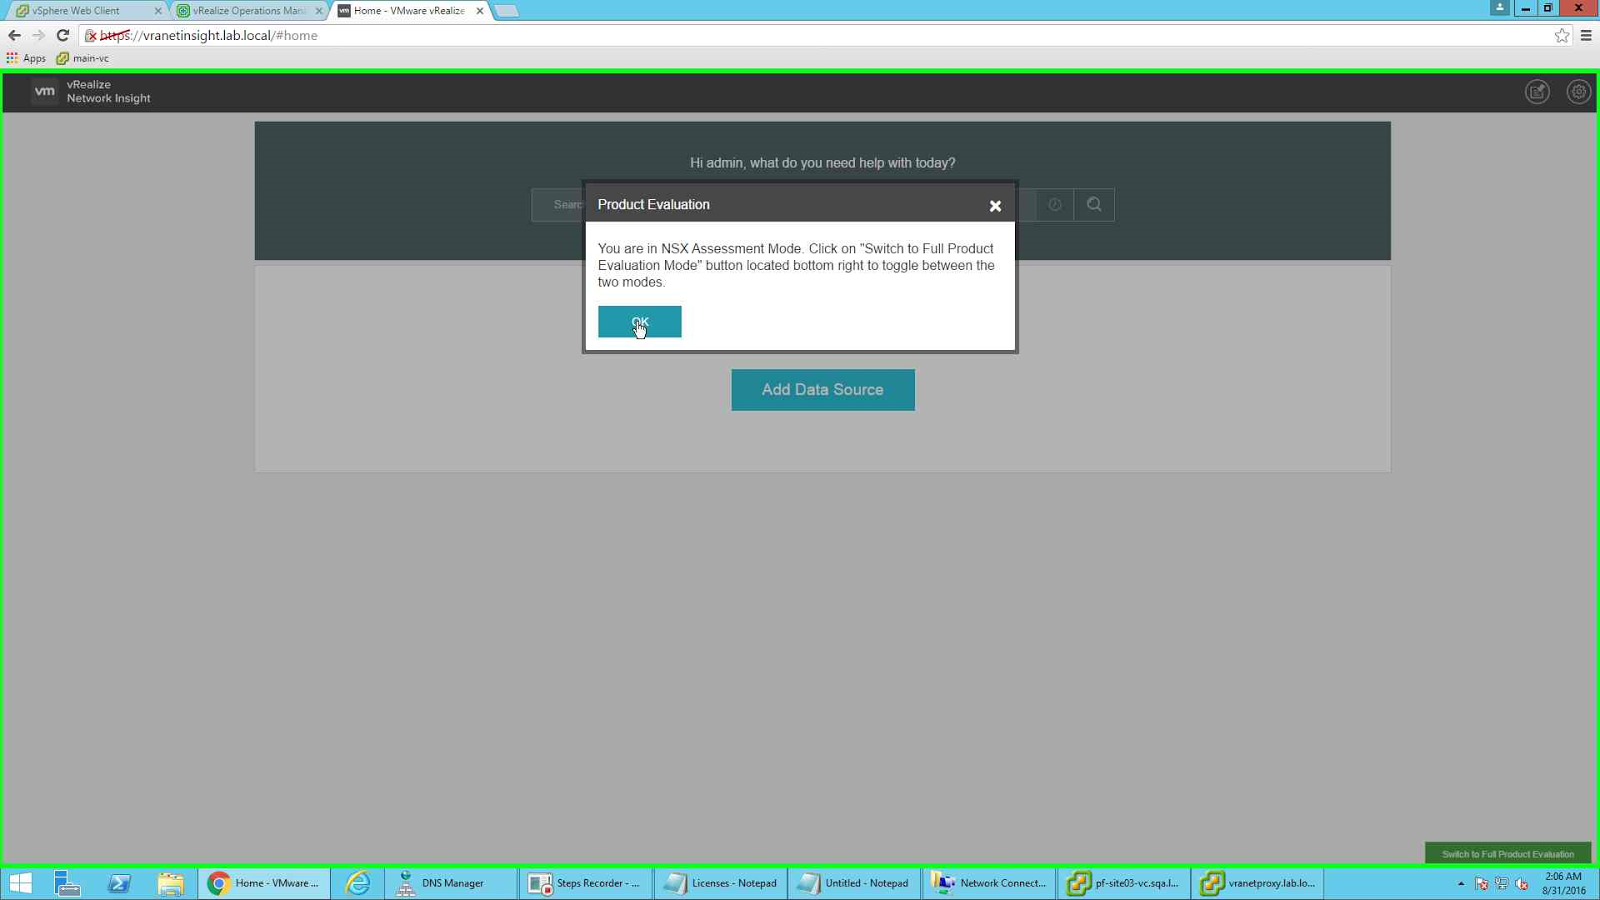 |
| Change or accept the current mode |
If you click on the change mode button (small green button at the bottom right corner of the page) you will be shown the details of the environment. Ideally it should be filled with data but since I did not configure any data sources till now so it is all blank.
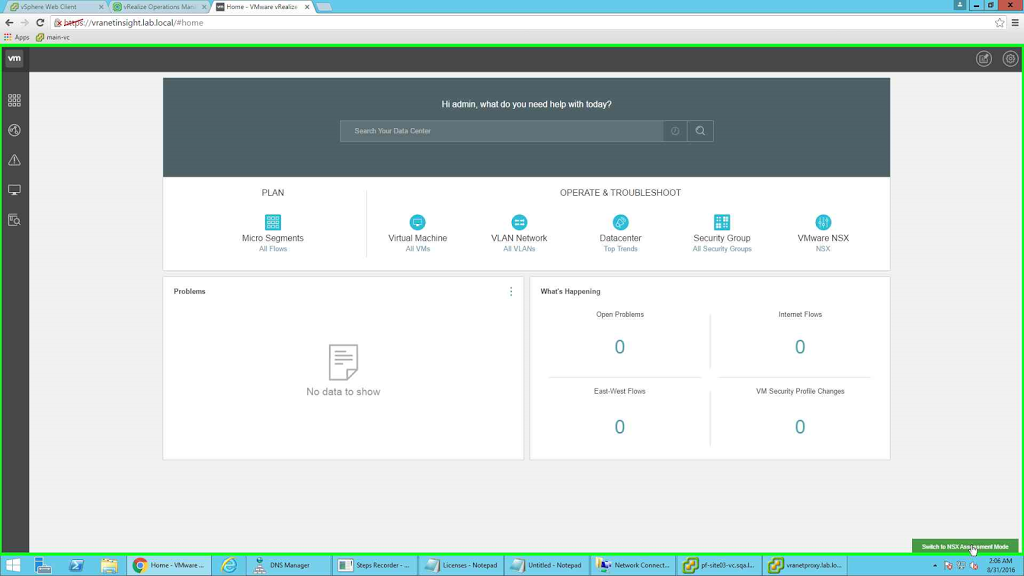 |
| Full Evaluation Mode |
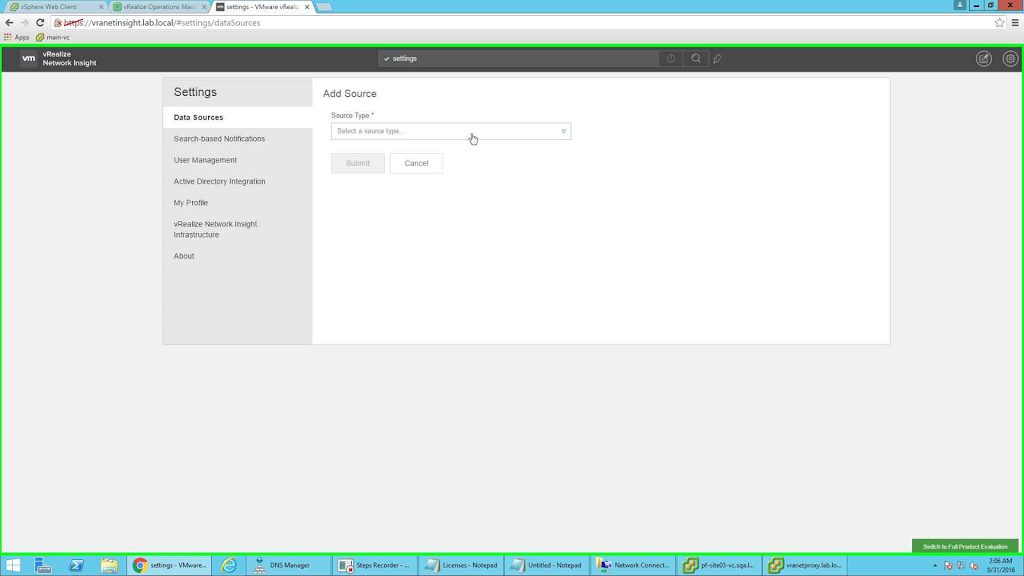
So we will go back and add data source. The first data source is vCenter sever.
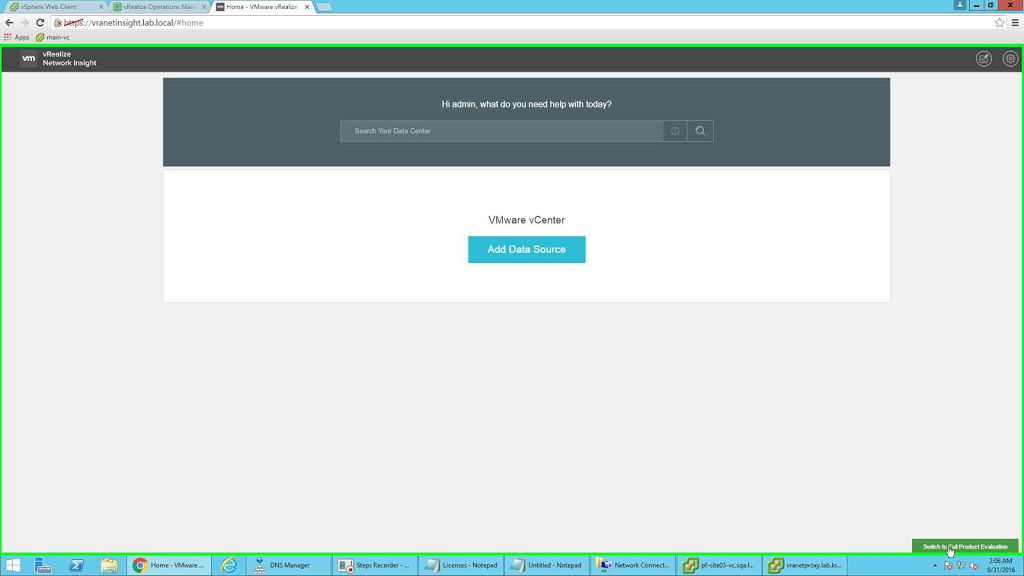 |
| Add Data source |
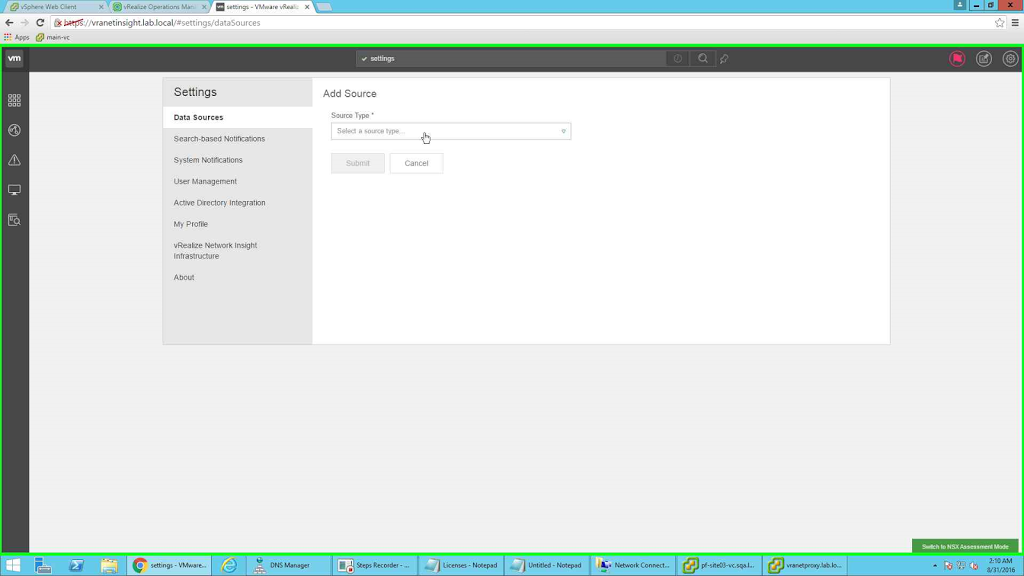
Clicking on the link takes you to the addition of Data Sources Page. Go to the page and click on "Add new source".
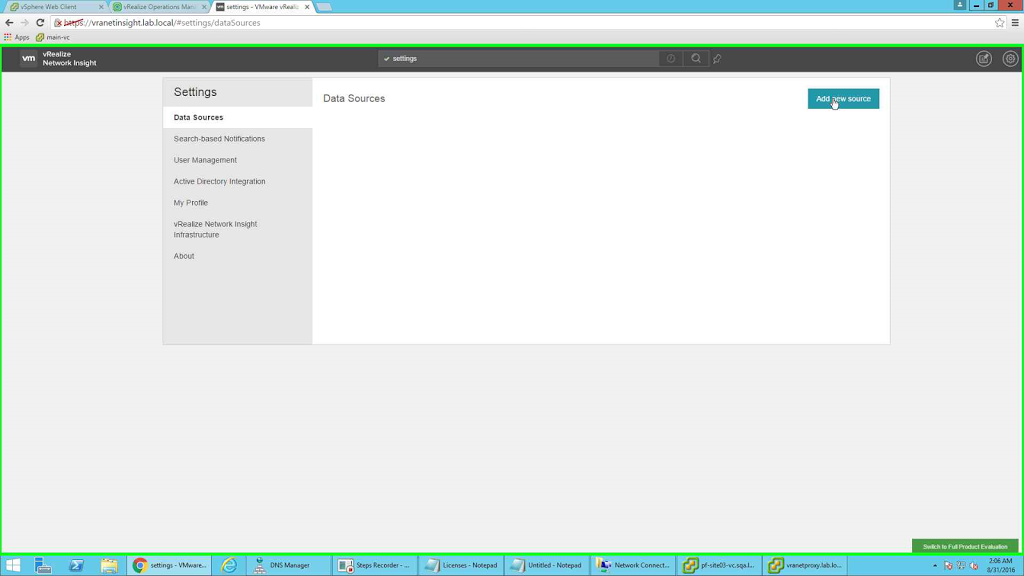 |
| Add new source |
First you need to select a source.
 |
| Select Source |
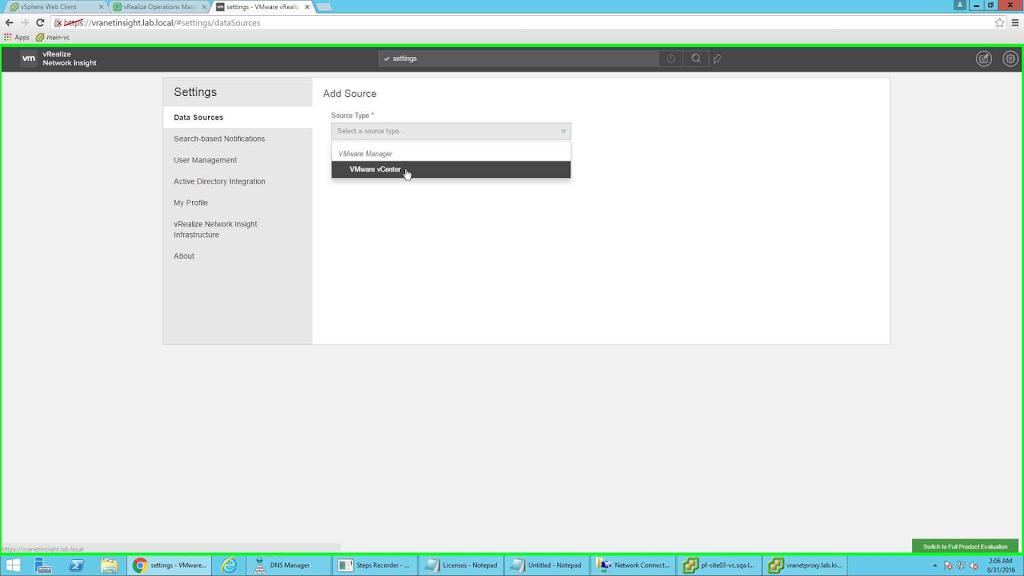
The first source available is VMware vCenter
 |
| VMware vCenter as source type |
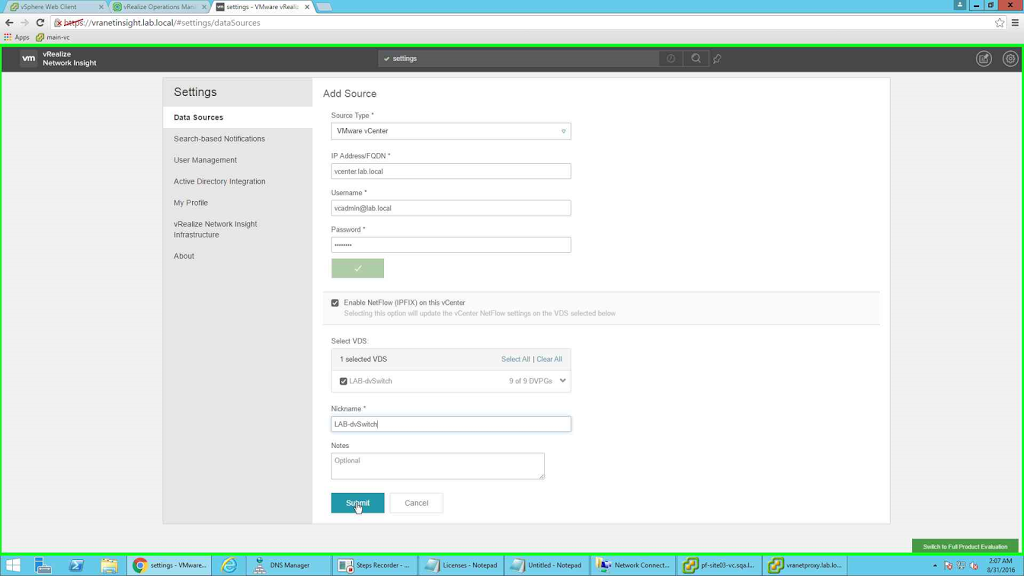
Provide details of the vCenter:
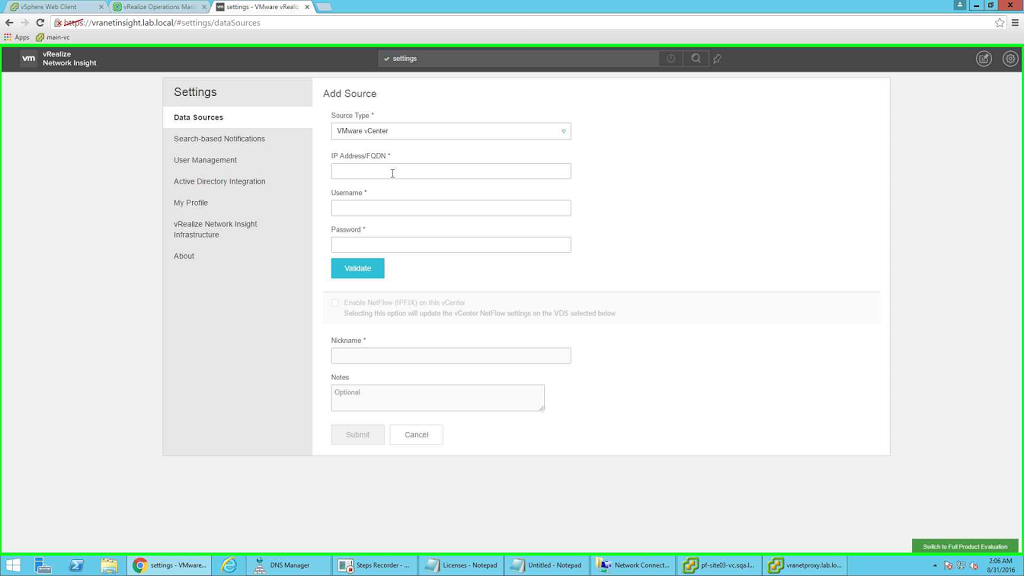
I love the way the button changes color with and without the details. After you provide the details you need to click on Validate to validate the details.
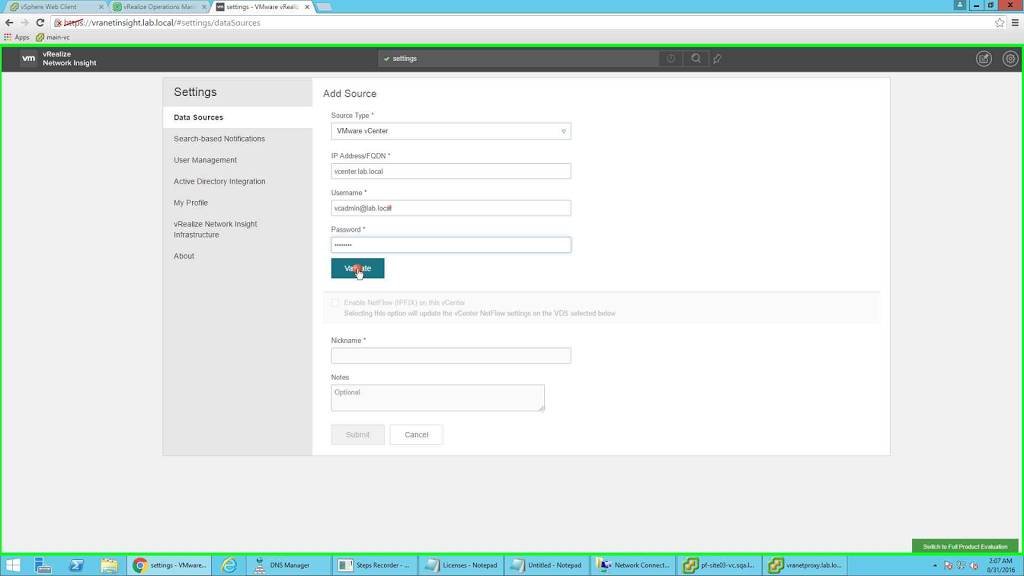
Once the details are validated, all the available VDS are listed and you have the option to enable NetFlow on the vCenter. If you want to enable it, select the required options and click on Submit.
 |
| Configuring NetFlow |
So we are done with first data source configuration.
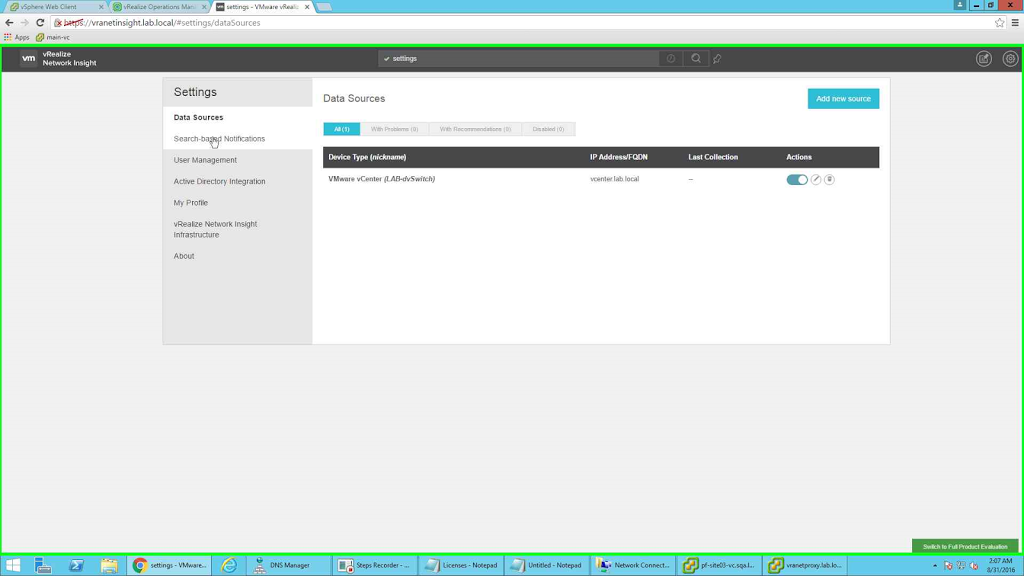 |
| Configured Data Source |
Since we have configured the first source, let us see what other options are available. The first thing that I do is integrate the solution with Active Directory so that I can easily configure role based access control. So let's start this configuration by Clicking on "Active Directory Integration" on the left hand side and select the option to enable it.
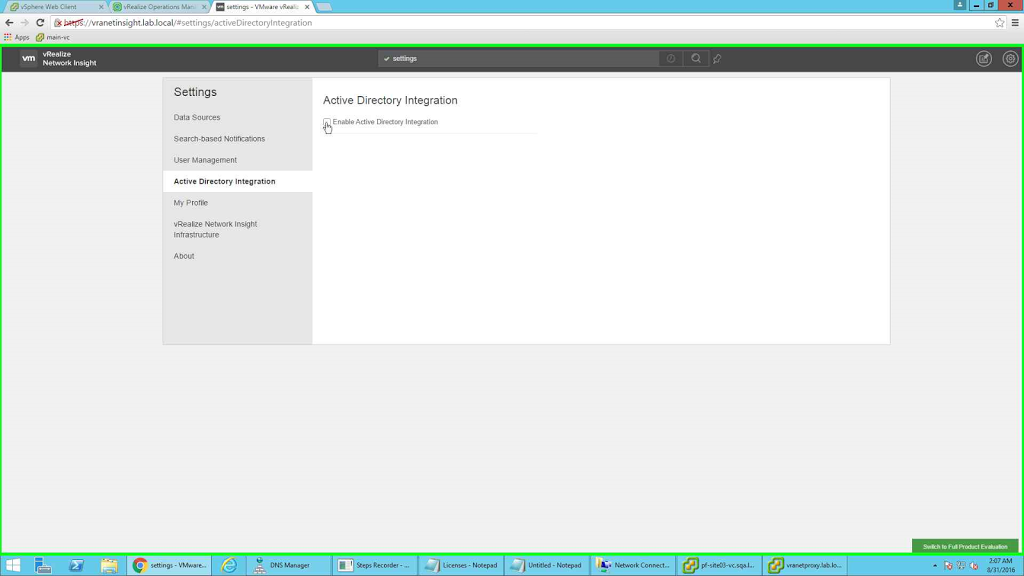 |
| Enabling AD |
In the details page provide the details of the AD and click on Save to save the information.
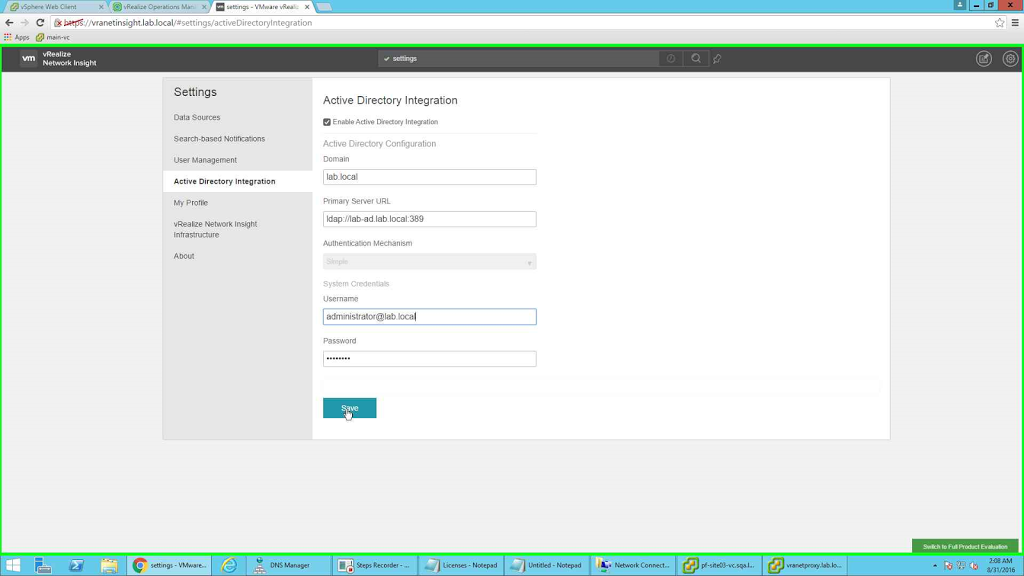 |
| Details of AD |
AD is configured. I will configure the user later. For the time I need to change the default password. For that click on "My Profile" and change the password.
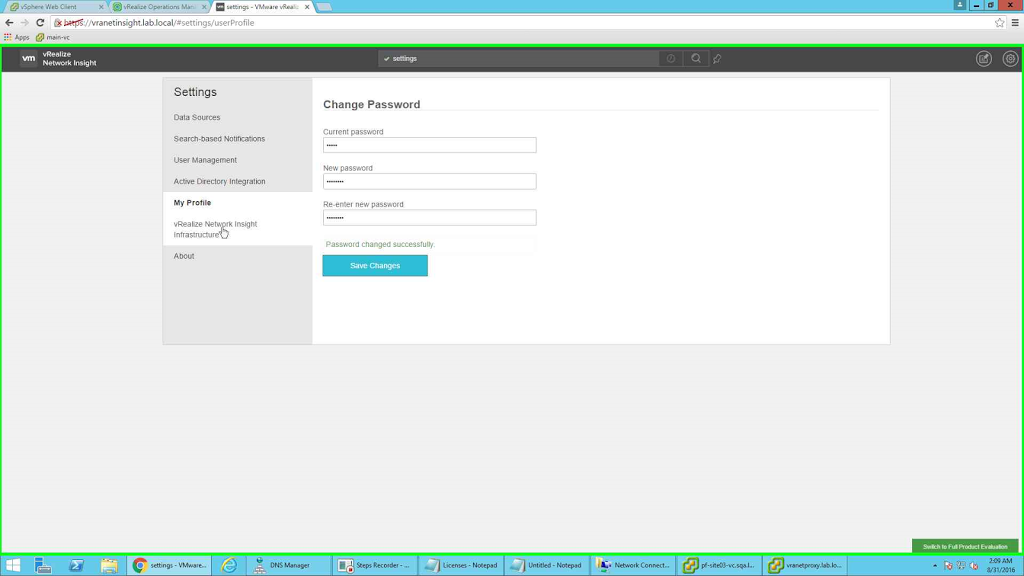 |
| Change Password |
We can check the Infrastructure state from the left side option.
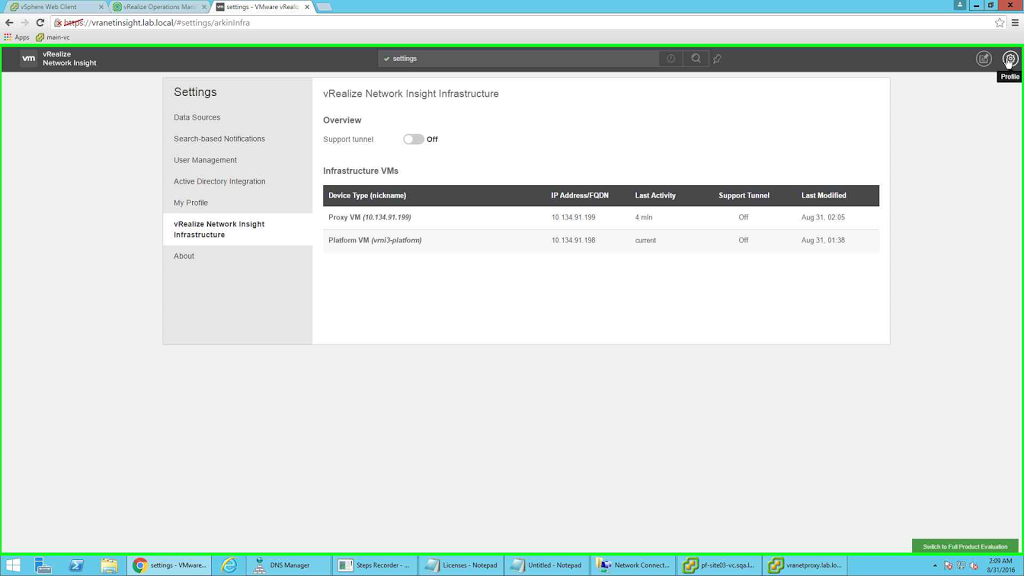 |
| Check status |
Since we have done basic house keeping so let's add NSX as another data source. We will again visit the "Data Source" button.
 |
| Add Data Source |
Now if you click on "Select Source Type" list you will see a lot more option. I will choose NSX Manager from the list.
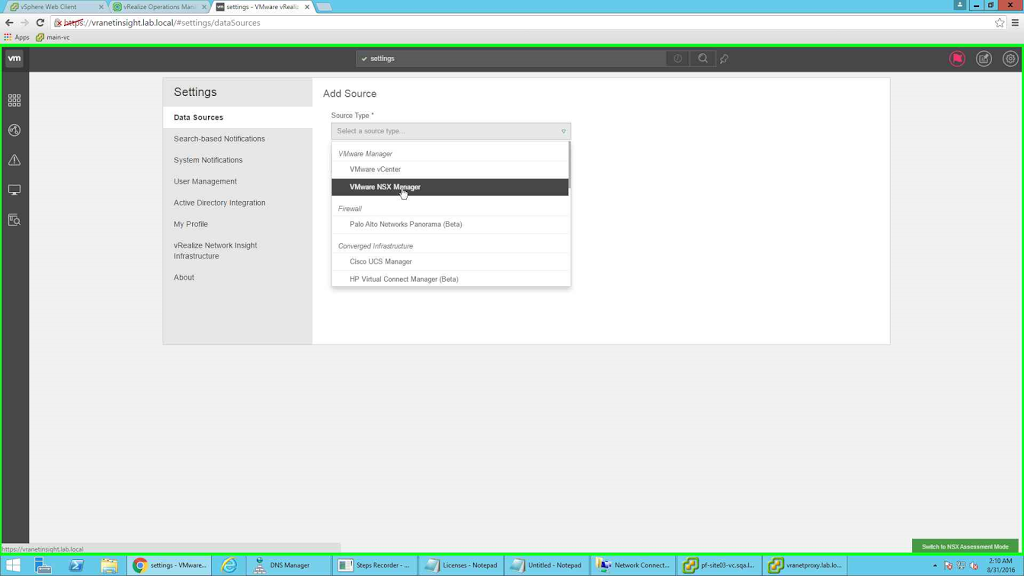 |
| NSX as Data Source |
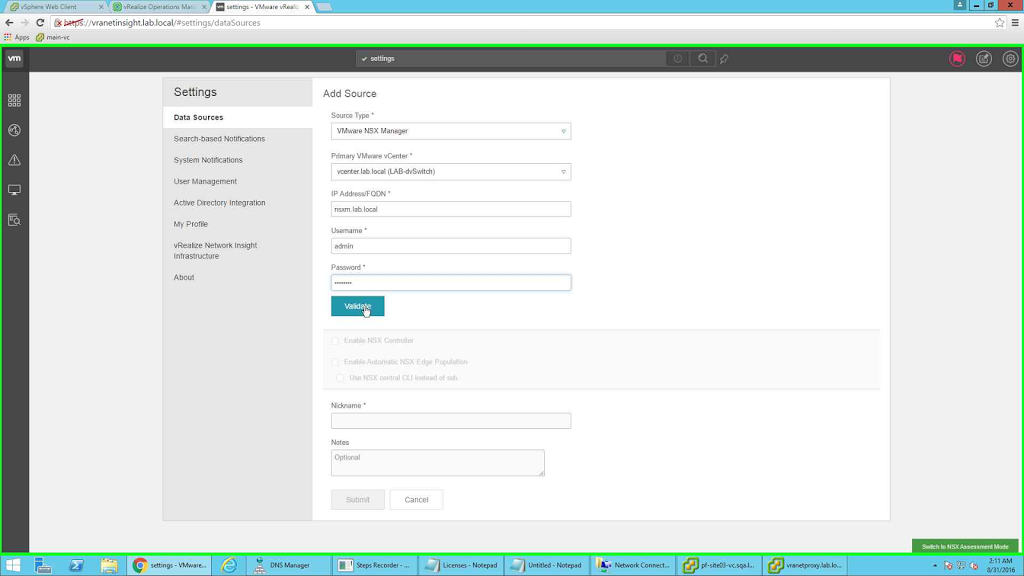
Next provide the details of the NSX Manager and Validate.
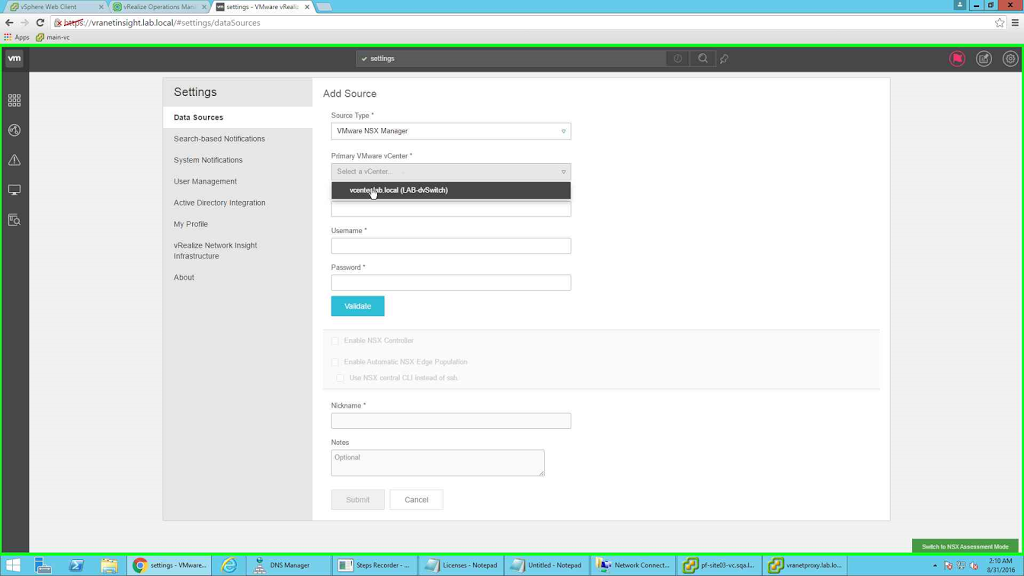 |
| Provide details of NSX |
For my environment I will enable "Enable NSX Controller".
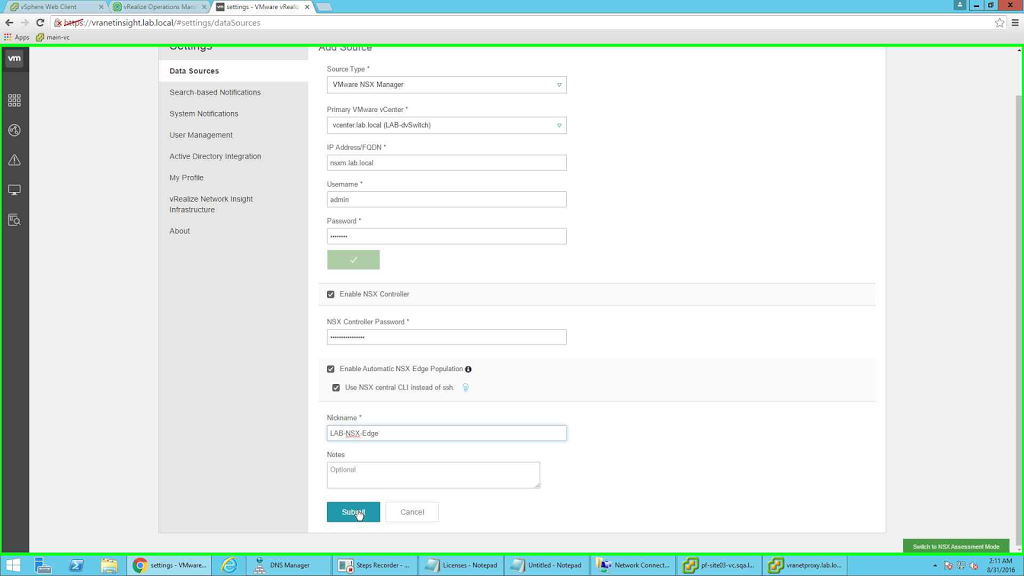 |
| Enable NSX Controller |
Everything configured.
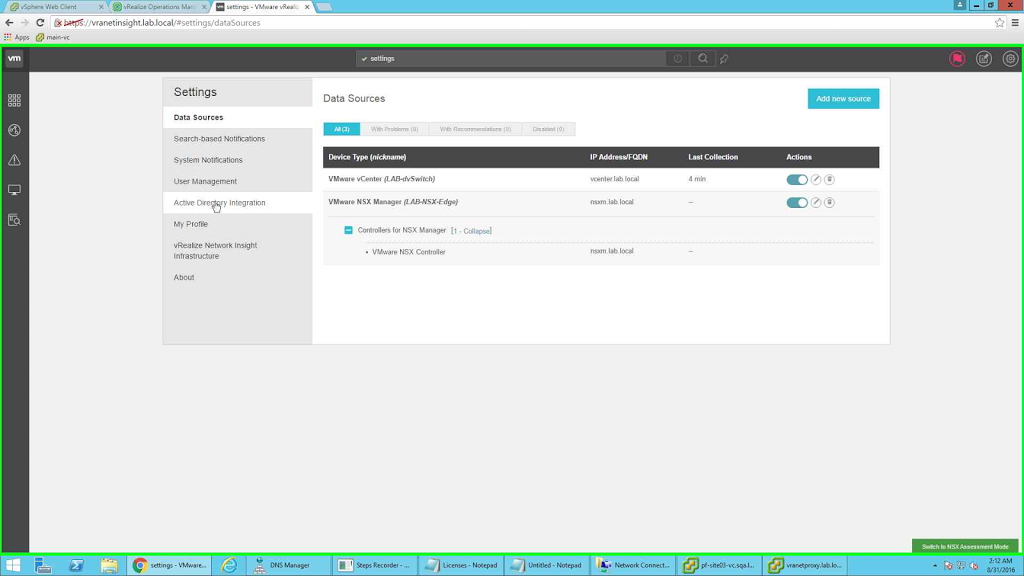 |
| Sources configured |
You can configure the system notifications.
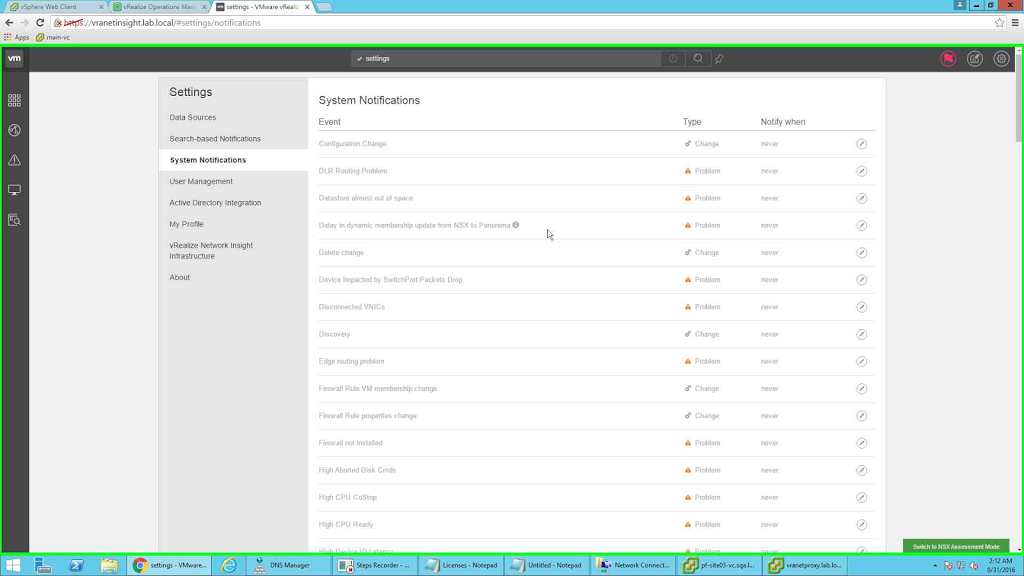 |
| System Notification |
Since everything is configured, let's check the information. Next few screenshots shows how to see the details of a single ESXi host.
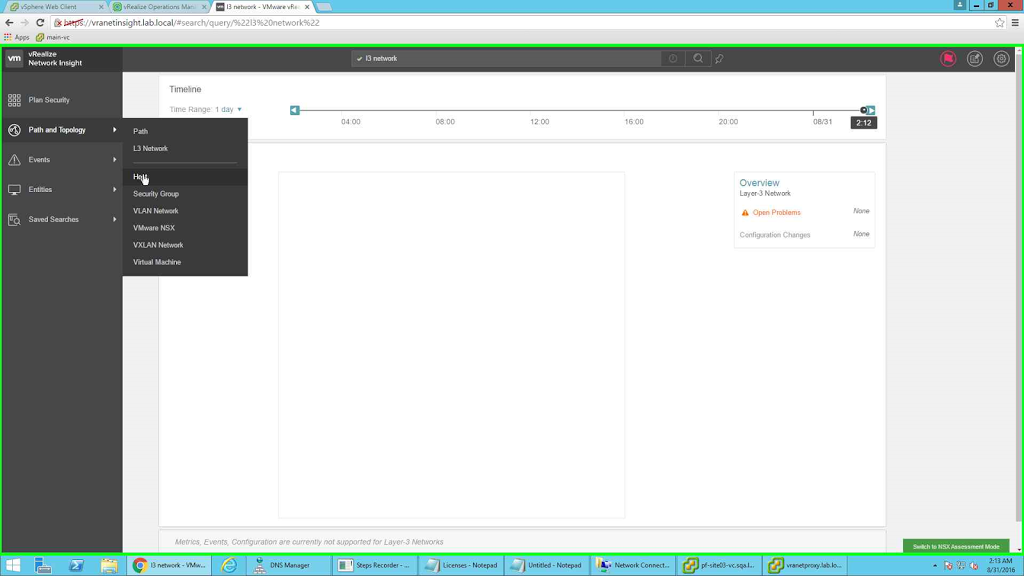 |
| Select host from left side option |
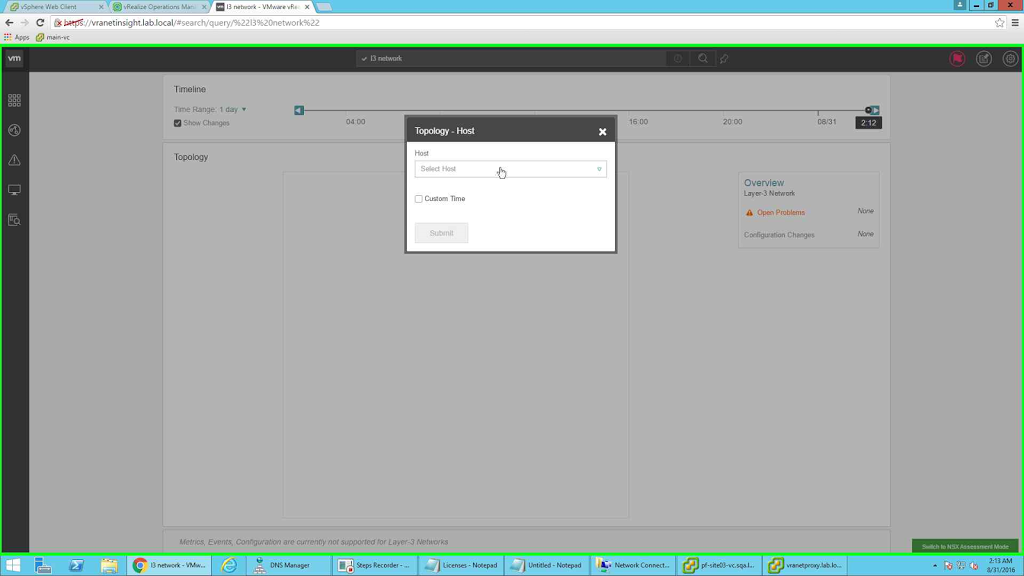 |
| Click on select host |
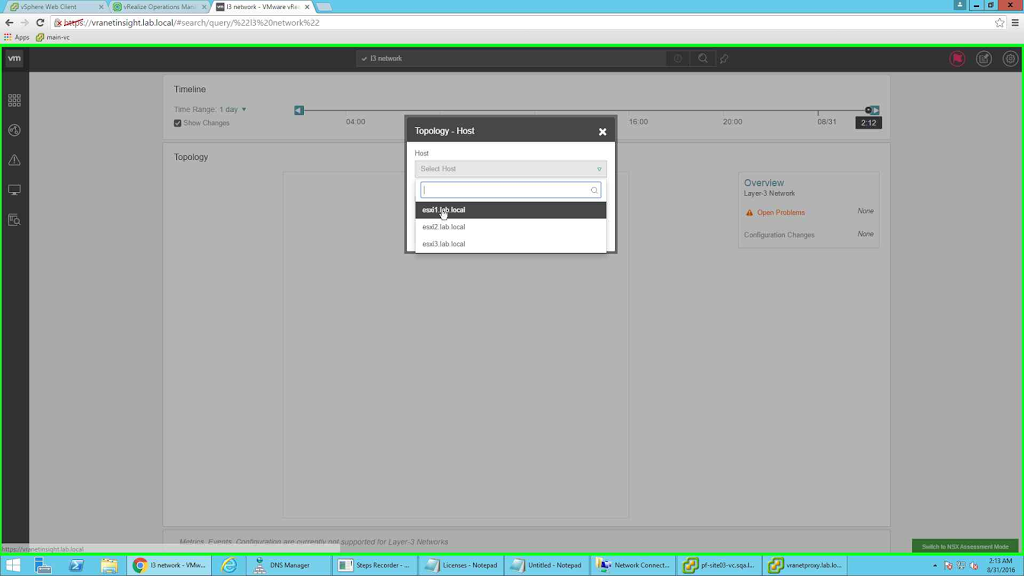 |
| Select the host for which you want to see the details |
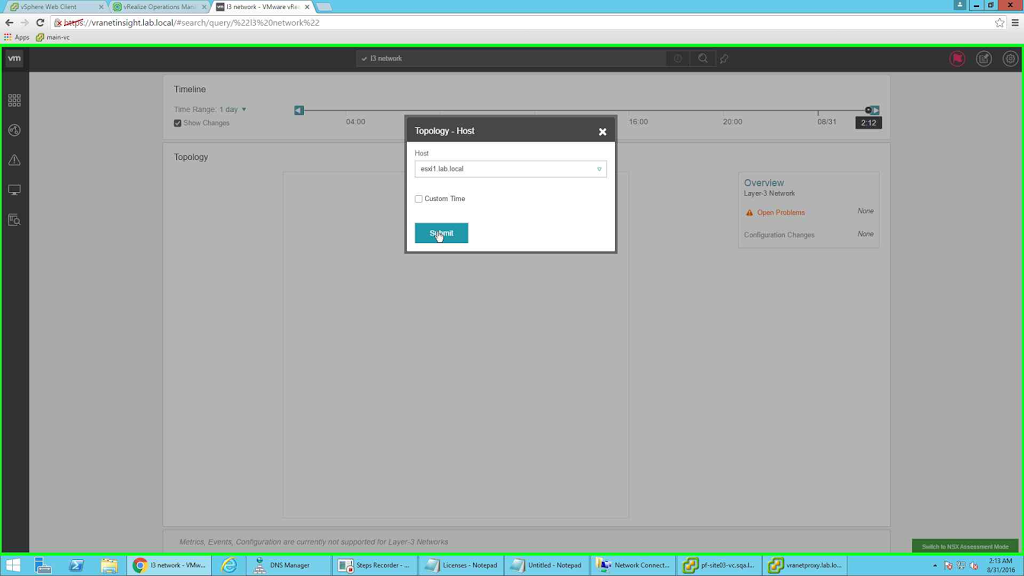 |
| Submit the request. You can modify the time frame for which you want to see the details |
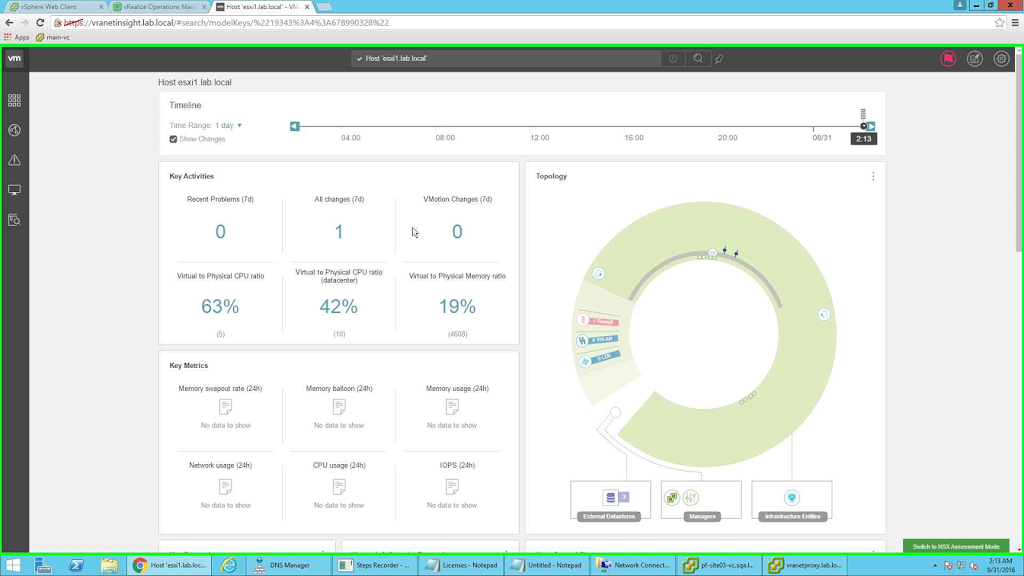 |
| All the statistics |
Similarly I chose to see the details of the NSX manager.
 |
| NSX Details 1 |
 |
| Scrolled down view for more information |
This is an awesome tool to monitor your network environment. I am pretty impressed with the capabilities.Do let me know your feedback about this.